2021 annual report
We're a UK charity that supports food banks around the country. We do this by using technology to identify what is needed at food banks, distributing this information and also making our own deliveries.
We run the largest and most complete public database of UK food banks and scrape their websites for what they are requesting in real time.
Summary
It's been a much quieter year for the charity in 2021 and we've used this time to take stock of the extremely rapid growth and uncertainty experienced in 2020.
- Around 7 million people viewed our food bank need data
- Completely rewrote of key parts of our tooling
- 10x conversion rate improvement from UX review and redesign of most of our website
- Delivered 15.8 tonnes of food & supplies containing 14.3 million calories, enough for about 22,000 meals
Aim Review
In the 2020 annual report we set ourselves the following aims:
- Release more data, including dashboards
- Improve data & code quality with audits and rewrites
- Find methods of finding & communicating with food banks that aren't internet-savvy
- Reach out to more independent food banks
- Create a tool to allow users to better contact their local and national political representatives about the food bank cause
Release more data, including dashboards
✅ In 2021 we built dashboards to aggregate and display our data for consumption by interested parties.
Our dashboards aggregate unique data to create leading indicators of demand at food banks and are used by multiple organisations.
We also worked with the knowledgeable members of the Talk-GB OpenStreetMap mailing list to ensure our data was able to be correctly licensed for reuse.
Improve data & code quality with audits and rewrites
✅ This is the biggest area of improvement this year with significant improvements made across the board drastically improving the quality of our data and code.
First to be rewritten was the political data. Previously administrative district, ward, LSOA, MSOA and parliamentary constituency was an after-thought included as a curiosity, but as our understanding of food banks grew it was clear a rewrite was needed, which we did in August.
This has allowed us to build and expose far higher quality political mapping to users via the website and API, plus analyse where users are looking to donate to more accurately.

We've also undertaken two time consuming complete manual audits of our data during the year and refined our automated monitoring of food bank network data.
Find methods of finding & communicating with food banks that aren't internet-savvy
❌ Again we've not managed to do this task, and it's increasingly unclear how we would be able to. As such we're currently unable to index food banks that don't have some form of digital presence.
Reach out to more independent food banks
✅ In addition to refining how we catalogue networked food banks, we've successfully continued to seek out food banks that aren't part of the Trussell Trust or IFAN. We've found 851 independent food bank locations, which is up from 833 in 2020.
Keeping track of popup and rapidly changing food bank locations during the pandemic has continued to be more of a challenge than we anticipated.
Create a tool to allow users to better contact their local and national political representatives about the food bank cause
❌ Although all the components and data are now in place, we haven't done this and will rollover the aim to next year.
UX Review & Redesign
As our website traffic grew threefold over the year we realised that the public-facing pages were not suitable for the audience that was using them.
Previously the pages were modelled on our internal dashboards with a lot of information crammed into single pages optimised for use on a desktop computer. These were (unconsciously) designed for 30-something year old computing professionals, on modern computers, accessing them via fast broadband connections.
As we were unable to do any in-person user testing we relied on tooling such as Google Ads, Google Analytics, Plausible and Microsoft Clarity to understand who our users were, the tech they were using to access the content and what they did with it.
- Nearly half our users are over the age of 55
- 70% of users accessed our content via a mobile device
- Around half of mobile users were using a device older than about two or three years old
This data, when combined with heatmaps and user journey recordings from Microsoft Clarity, clearly showed that our pages did not meet the needs of the users.

We embarked on a complete revamp of these pages with the aim of simplifying them to be mobile-friendly, faster, and more quickly understood.

Pages now build and load over twice as fast, have clearer calls to action, surface more data and result in 10x the conversion rate. We'll be tweaking this throughout next year and taking another pass at optimising them.

Data & Code
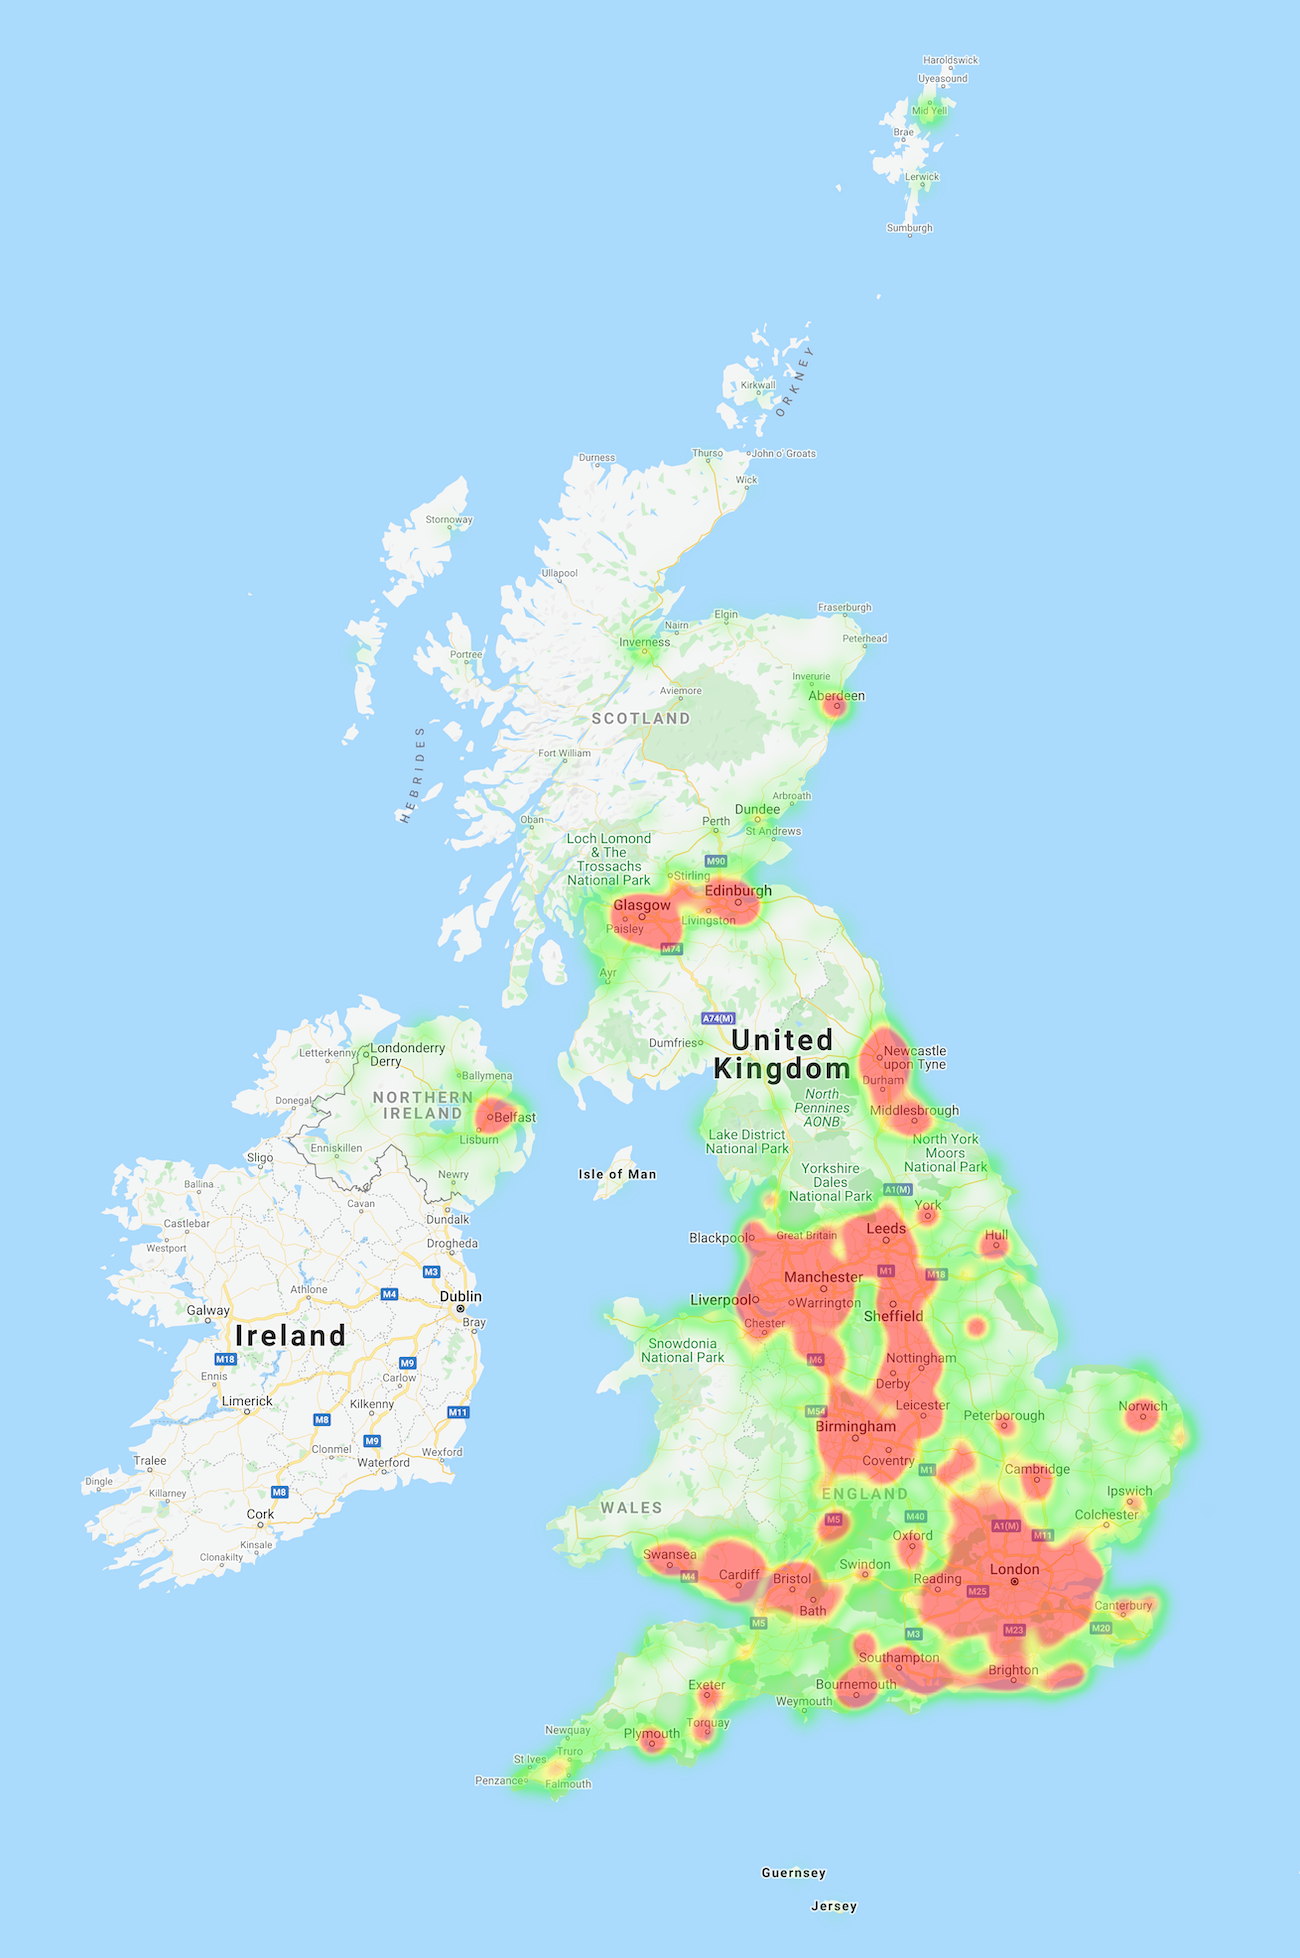
We continue to maintain the UK's largest and most complete database of food banks covering 2422 locations (up from 2329 last year).
We checked food bank websites for what they need just over 3m times in 2021 (up from 2.82m times in 2020, and 2.11m in 2019) and found over 46,000 items being requested.
In February we added the ability for users to subscribe to food bank requests via email and RSS.

Charity Reporting
2021 was the first year we were able to publish our charity accounts. This happened in June and is available on the Charity Commission website.
Aims for 2022
- Create a tool to allow users to better contact their local and national political representatives about the food bank cause
- Monitor food bank surplus as well as need
- Faster complete data audits throughout the year
- Continue to publish more dashboards & data
